Finance PowerPoint Templates, Presentation Slide Diagrams & PPT Graphics
- Sub Categories
-
- 30 60 90 Day Plan
- Advertising
- Agile Development
- Aims and Objectives
- Arrows
- Before and After
- Blockchain Bitcoin
- Boxes
- Business
- Calender
- Case Study
- Celebrations
- Certificates
- Challenges Opportunities
- Channel Distribution
- Children
- Communication
- Competitive Landscape
- Computer
- Concepts
- Construction Management
- Corporate
- Crowdfunding
- Current State Future State
- Custom PowerPoint Diagrams
- Digital Transformation
- Dos and Donts
- Economics
- Education
- Environment
- Events
- Festival
- Finance
- Financials
- Food
- Game
- Gap Analysis
- Generic
- Geographical
- Health
- Heatmaps
- Holidays
- Icons
- Input Process Output
- Internet
- Key Messages
- Key Wins
- Ladder
- Leadership
- Lists
- Lucky Draw
- Management
- Marketing
- Measuring
- Medical
- Music
- News
- Next Steps
- People Process Technology
- Pillars
- Planning
- Post-it-Notes
- Problem Statement
- Process
- Proposal Management
- Pros and Cons
- Puzzle
- Puzzles
- Recruitment Strategy
- Religion
- Research and Development
- Risk Mitigation Strategies
- Roadmap
- Selling
- Shapes
- Short Term Long Term
- Social
- Stairs
- Start Stop Continue
- Strategy
- Symbol
- Technology
- Thesis Defense Dissertation
- Timelines
- Traffic
- Transition Plan
- Transportation
- Vehicles
- Venture Capital Funding
- Warning
- Winners
- Word Cloud
-
 Project Issue Tracking KPI Dashboard
This slide illustrates the dashboard for the project issue tracking and management. It includes the column chart for issues assignee, incomplete issues by priority and project, monthly percentage increase in issues created and closed, etc. Presenting our well structured Project Issue Tracking KPI Dashboard. The topics discussed in this slide are Project Issue Tracking, KPI Dashboard, Issue Status. This is an instantly available PowerPoint presentation that can be edited conveniently. Download it right away and captivate your audience.
-
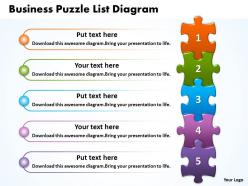 Business puzzle list diagarm free powerpoint templates download
This PowerPoint slide shows 5 puzzles list diagram. There is a lot of space available for writing your text. You can easily edit the size, position, text, color.
-
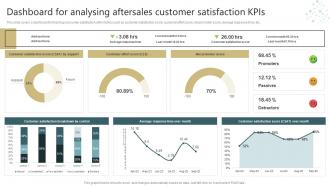 Conducting Successful Customer Dashboard For Analysing Aftersales Customer Satisfaction Kpis
This slide covers a dashboard for tracking consumer satisfaction with metrics such as customer satisfaction score, customer effort score, net promoter score, average response time, etc. Present the topic in a bit more detail with this Conducting Successful Customer Dashboard For Analysing Aftersales Customer Satisfaction Kpis. Use it as a tool for discussion and navigation on Satisfaction, Response, Promoter. This template is free to edit as deemed fit for your organization. Therefore download it now.
-
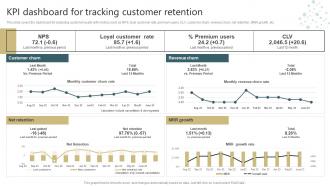 Conducting Successful Customer Kpi Dashboard For Tracking Customer Retention
This slide covers the dashboard for analyzing customer loyalty with metrics such as NPS, loyal customer rate, premium users, CLV, customer churn, revenue churn, net retention, MRR growth, etc. Deliver an outstanding presentation on the topic using this Conducting Successful Customer Kpi Dashboard For Tracking Customer Retention. Dispense information and present a thorough explanation of Rate, Premium Users using the slides given. This template can be altered and personalized to fit your needs. It is also available for immediate download. So grab it now.
-
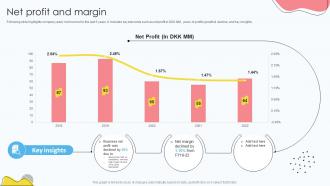 Risk Management Company Profile Net Profit And Margin CP SS V
Following slide highlights company yearly net income for the last 5 years. It includes key elements such as net profit in DKK MM, years of profits growth and decline, and key insights. Deliver an outstanding presentation on the topic using this Risk Management Company Profile Net Profit And Margin CP SS V. Dispense information and present a thorough explanation of Business Net Profit, Net Margin Declined using the slides given. This template can be altered and personalized to fit your needs. It is also available for immediate download. So grab it now.
-
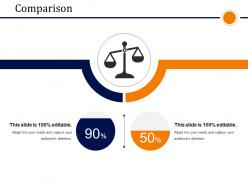 Comparison presentation powerpoint example
Effortlessly transmuted into other format such as JPEG and PDF. PowerPoint design can be displayed in standard and widescreen view. Easily adaptable presentation slide as editing permissible with color, text and shape. Matching designs downloadable with different nodes and stages. Access to give personal touch to the presentation with business emblem and name. Presentation template matched with Google slides as well.
-
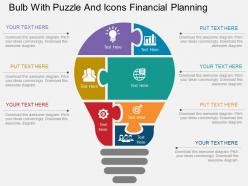 Eb bulb with puzzle and icons financial planning flat powerpoint design
Bulb with puzzle and icons PPT Slide. Modify and personalize the presentation by including the company name and logo. Pictures graphics do not pixelate when projected on wide screen. Compatible with multiple software options available both online and offline. Widely used by sales leaders, marketers, business professionals, analysts, strategists, etc. High resolution and fine quality PowerPoint slides.
-
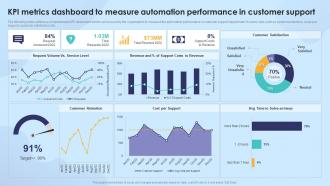 Strengthening Process Improvement KPI Metrics Dashboard To Measure Automation Performance
The following slide outlines a comprehensive KPI dashboard which can be used by the organization to measure the automation performance in customer support department. It covers kpis such as customer retention, costs per support, customer satisfaction, etc. Present the topic in a bit more detail with this Strengthening Process Improvement KPI Metrics Dashboard To Measure Automation Performance. Use it as a tool for discussion and navigation on Request Volume Vs Service Level, Customer Satisfaction, Cost Per Support, Customer Retention. This template is free to edit as deemed fit for your organization. Therefore download it now.
-
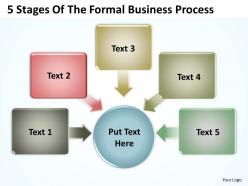 5 stages of the formal business process powerpoint templates ppt presentation slides 812
Use these multicolored textboxes around a circle to explain a formal business process
-
 Department Store Business Plan Us Food And Grocery Retail Market BP SS V
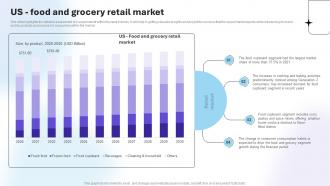
This slide highlights the detailed assessment of a supermarket within the retail industry. It will help in getting valuable insights and project the success that the supermarket expects while introducing its brand and its products and services to consumers within the market. Deliver an outstanding presentation on the topic using this Department Store Business Plan Us Food And Grocery Retail Market BP SS V. Dispense information and present a thorough explanation of Food And Grocery Retail Market, Products And Services To Consumers, Supermarket Expects using the slides given. This template can be altered and personalized to fit your needs. It is also available for immediate download. So grab it now.
-
 Executive Summary Telecommunications Device Offering Company Profile CP SS V
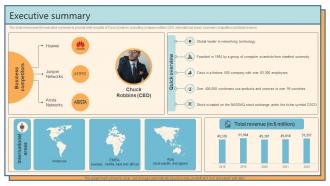
The slide showcases the executive summary to provide brief insights of Cisco Systems, including company outline, CEO, international areas, business competitors and total revenue. Deliver an outstanding presentation on the topic using this Executive Summary Telecommunications Device Offering Company Profile CP SS V Dispense information and present a thorough explanation of Headquarters In Regions, Cisco Systems using the slides given. This template can be altered and personalized to fit your needs. It is also available for immediate download. So grab it now.
-
 Key Financial Chart E Commerce And Retail Services Company Profile CP SS V
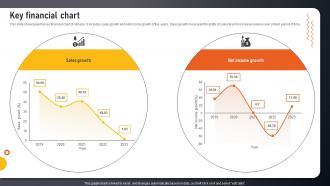
This slide showcases the key financial chart of Alibaba. It includes sales growth and net income growth of five years. Sales growth measures the ability of sales team to increase revenue over a fixed period of time. Present the topic in a bit more detail with this Key Financial Chart E Commerce And Retail Services Company Profile CP SS V. Use it as a tool for discussion and navigation on Sales Growth, Net Income Growth. This template is free to edit as deemed fit for your organization. Therefore download it now.
-
 Global Market Size Of Robotics Surgery In Embracing Digital Transformation In Medical TC SS
The following slide contains global market size robotics surgery in medical industry. It includes global value from year 2023 to 2032, compound annual growth rate and key insights. Deliver an outstanding presentation on the topic using this Global Market Size Of Robotics Surgery In Embracing Digital Transformation In Medical TC SS. Dispense information and present a thorough explanation of Global Market Size, Robotics Surgery, Healthcare using the slides given. This template can be altered and personalized to fit your needs. It is also available for immediate download. So grab it now.
-
 Ge mckinsey matrix powerpoint presentation slides
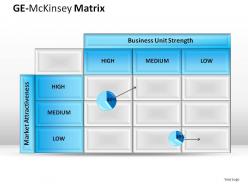
High quality PPT graphics don’t pixelate when projected on big screens. Each element of the sample PPT file is 100% editable and can be modified as per ones preference. This GE matrix PPT template can be saved in any of the desired format. It’s easy to replace the watermark on slide background with the company logo or name. Brand managers, product managers, business analysts, shareholders, professors and students can use this GE 9 cell model presentation PowerPoint template when required.
-
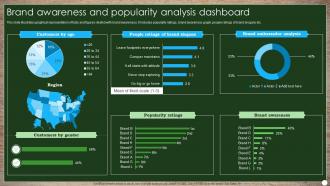 Brand Awareness And Popularity Analysis Dashboard
This slide illustrates graphical representation of facts and figures related with brand awareness. It includes popularity ratings, brand awareness graph, people ratings of brand slogans etc. Introducing our Brand Awareness And Popularity Analysis Dashboard set of slides. The topics discussed in these slides are Customers By Gender, Popularity Ratings, Brand Awareness. This is an immediately available PowerPoint presentation that can be conveniently customized. Download it and convince your audience.
-
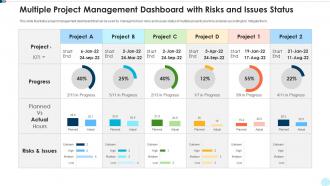 Multiple project management dashboard with risks and issues status
Presenting our well structured Multiple Project Management Dashboard With Risks And Issues Status. The topics discussed in this slide are MSP Framework For Risk And Issue Management. This is an instantly available PowerPoint presentation that can be edited conveniently. Download it right away and captivate your audience.
-
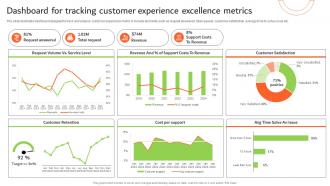 Dashboard For Tracking Customer Experience Excellence Metrics
The slide illustrates dashboard designed to track and analyze customer experience metric. It include elements such as request answered, total request, customer satisfaction, average time to solve issue etc. Introducing our Dashboard For Tracking Customer Experience Excellence Metrics set of slides. The topics discussed in these slides are Request Answered, Total Request, Revenue. This is an immediately available PowerPoint presentation that can be conveniently customized. Download it and convince your audience.
-
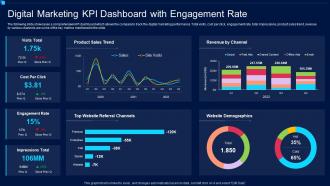 Digital Marketing KPI Dashboard Snapshot With Engagement Rate
The following slide showcases a comprehensive KPI dashboard which allows the company to track the digital marketing performance. Total visits, cost per click, engagement rate, total impressions, product sales trend, revenue by various channels are some of the key metrics mentioned in the slide. Introducing our Digital Marketing KPI Dashboard Snapshot With Engagement Rate set of slides. The topics discussed in these slides are Product Sales Trend, Revenue By Channel, Top Website Referral Channels, Website Demographics, Engagement Rate, Impressions Total. This is an immediately available PowerPoint presentation that can be conveniently customized. Download it and convince your audience.
-
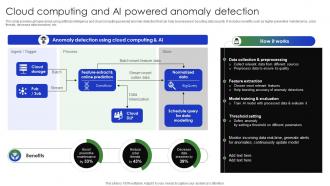 Cloud Computing And Ai Powered Anomaly Detection Complete Guide Of Digital Transformation DT SS V
This slide provides glimpse about using artificial intelligence and cloud computing powered anomaly detection that can help businesses in boosting data security. It includes benefits such as higher preventive maintenance, cyber threats, decrease data breaches, etc. Deliver an outstanding presentation on the topic using this Cloud Computing And Ai Powered Anomaly Detection Complete Guide Of Digital Transformation DT SS V. Dispense information and present a thorough explanation of Process, Benefits, Cloud Storage using the slides given. This template can be altered and personalized to fit your needs. It is also available for immediate download. So grab it now.
-
 Budget Allocated To Various Marketing Activities Optimizing Companys Sales SA SS
This slide showcases the budget allocation for team training, referral programs, website optimization, product giveaways, email, SMS, PPC and content marketing. Present the topic in a bit more detail with this Budget Allocated To Various Marketing Activities Optimizing Companys Sales SA SS. Use it as a tool for discussion and navigation on Budget Allocated, Marketing Activities, Content Marketing, Team Training, Referral Programs. This template is free to edit as deemed fit for your organization. Therefore download it now.
-
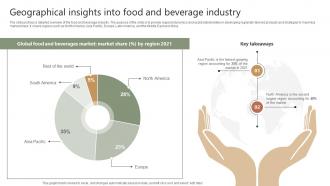 Food Industry Report Geographical Insights Into Food And Beverage Industry IR SS V
The slide portrays a detailed overview of the food and beverage industry. The purpose of the slide is to provide regional dynamics and assist stakeholders in developing regionally-tailored products and strategies to maximize market share. It covers regions such as North America, Asia Pacific, Europe, Latin America, and the Middle East and Africa. Present the topic in a bit more detail with this Food Industry Report Geographical Insights Into Food And Beverage Industry IR SS V. Use it as a tool for discussion and navigation on Geographical Insights, Food And Beverage Industry. This template is free to edit as deemed fit for your organization. Therefore download it now.
-
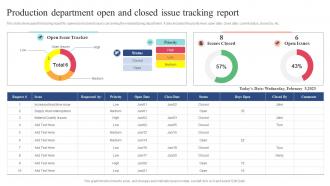 Production Department Open And Closed Issue Tracking Report
This slide showcases the tracking report for opened and closed issues concerning the manufacturing department. It also includes the priority level, open date, close date, current status, closed by, etc. Presenting our well structured Production Department Open And Closed Issue Tracking Report. The topics discussed in this slide are Production Department, Open Closed Issue, Tracking Report. This is an instantly available PowerPoint presentation that can be edited conveniently. Download it right away and captivate your audience.
-
 Business powerpoint templates shiney emoticon thinking face sales ppt slides
Use this Thinking Face to make your PowerPoint Presentation more informative and Expressive. It imitates the concept of gleam, glimmer, glisten, glitter, glow, envision, esteem, estimate, expect, fancy, feature, feel, foresee, gather, guess, hold, image, imagine, judge, plan for, presume, project, realize, vision, visualize.
-
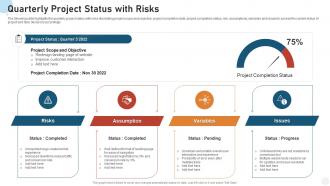 Quarterly project status with risks
Presenting our well structured Quarterly Project Status With Risks. The topics discussed in this slide are Risks, Assumption, Variables. This is an instantly available PowerPoint presentation that can be edited conveniently. Download it right away and captivate your audience.
-
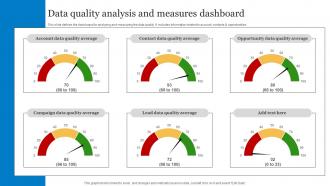 Data Quality Analysis And Measures Dashboard Snapshot
This slide defines the dashboard for analyzing and measuring the data quality. It includes information related to account, contacts and opportunities. Introducing our Data Quality Analysis And Measures Dashboard Snapshot set of slides. The topics discussed in these slides are Campaign Data, Quality Average, Opportunity Data. This is an immediately available PowerPoint presentation that can be conveniently customized. Download it and convince your audience.
-
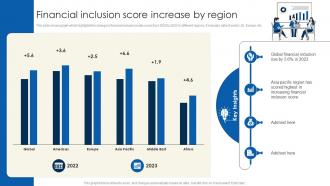 Financial Inclusion Score Financial Inclusion To Promote Economic Fin SS
This slide shows graph which highlights the change in financial inclusion index score from 2022 to 2023 in different regions. It includes data of world, US, Europe, etc. Deliver an outstanding presentation on the topic using this Financial Inclusion Score Financial Inclusion To Promote Economic Fin SS. Dispense information and present a thorough explanation of Global Financial Inclusion, Financial Inclusion Score, Key Insights using the slides given. This template can be altered and personalized to fit your needs. It is also available for immediate download. So grab it now.
-
 Big Data Technology In Healthcare Dashboard
This slide represents big data technology in healthcare dashboard which collects patients record and assists to manage hospital performance. It includes key components such as current occupancy rate, average cost per patient, etc. Introducing our Big Data Technology In Healthcare Dashboard set of slides. The topics discussed in these slides are Departments, Gynecology, Geriatrics. This is an immediately available PowerPoint presentation that can be conveniently customized. Download it and convince your audience.
-
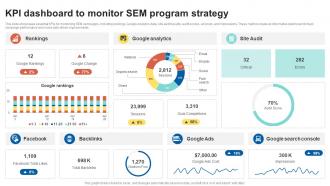 KPI Dashboard To Monitor SEM Program Strategy
This slide showcases essential KPIs for monitoring SEM campaigns, including rankings, Google Analytics data, site audit results, audit scores, ad costs, and impressions. These metrics create an informative dashboard to track campaign performance and make data-driven improvements. Introducing our KPI Dashboard To Monitor SEM Program Strategy set of slides. The topics discussed in these slides are Google Rankings, Google Analytics, Site Audit. This is an immediately available PowerPoint presentation that can be conveniently customized. Download it and convince your audience.
-
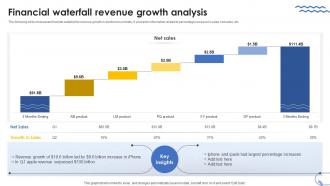 Financial Waterfall Revenue Growth Analysis
The following slide showcases financial waterfall for revenue growth in electronics industry. It presents information related to percentage increase in sales, net sales, etc. Introducing our Financial Waterfall Revenue Growth Analysis set of slides. The topics discussed in these slides are Financial Waterfall, Revenue, Growth Analysis. This is an immediately available PowerPoint presentation that can be conveniently customized. Download it and convince your audience.
-
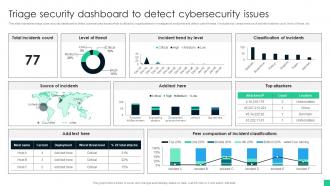 Triage Security Dashboard To Detect Cybersecurity Issues
This slide represents triage cyber security dashboard to detect cybersecurity issues which is utilized by organizations to investigate its endpoints and detect cyber threats. It includes key components such as total incidents count, level of threat, etc Introducing our Triage Security Dashboard To Detect Cybersecurity Issues set of slides. The topics discussed in these slides are Incident Trend By Level, Classification Of Incidents, Top Attackers. This is an immediately available PowerPoint presentation that can be conveniently customized. Download it and convince your audience.
-
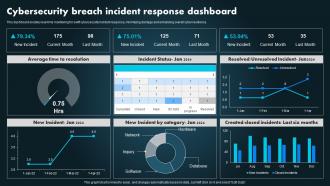 Cybersecurity Breach Incident Response Dashboard
This dashboard enables real-time monitoring for swift cybersecurity incident response, minimizing damage and enhancing overall cyber resilience. Presenting our well structured Cybersecurity Breach Incident Response Dashboard. The topics discussed in this slide are Cybersecurity Breach, Incident Response Dashboard, Overall Cyber Resilience. This is an instantly available PowerPoint presentation that can be edited conveniently. Download it right away and captivate your audience.
-
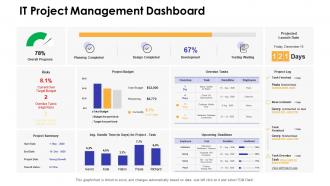 Dashboards by function it project management dashboard
Present the topic in a bit more detail with this Dashboards By Function It Project Management Dashboard. Use it as a tool for discussion and navigation on It Project Management Dashboard. This template is free to edit as deemed fit for your organization. Therefore download it now.
-
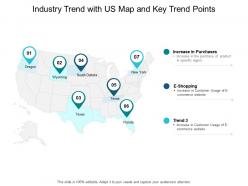 Industry trend with us map and key trend points
Presenting this set of slides with name Industry Trend With Us Map And Key Trend Points. This is a seven stage process. The stages in this process are Industry Trends, Online Banking, Centralized Network. This is a completely editable PowerPoint presentation and is available for immediate download. Download now and impress your audience.
-
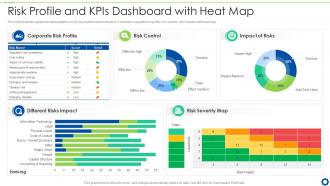 Risk Profile And KPIs Dashboard Snapshot With Heat Map
This slide illustrates graphical representation of risk key performance indicators. It includes corporate risk profile, risk control, risk impacts with heat map. Introducing our Risk Profile And KPIs Dashboard Snapshot With Heat Map set of slides. The topics discussed in these slides are Corporate Risk Profile, Risk Control, Impact of Risks, Different Risks Impact. This is an immediately available PowerPoint presentation that can be conveniently customized. Download it and convince your audience.
-
 Business powerpoint templates design of confused emoticon sales ppt slides
This PowerPoint Diagram shows you the Designs of Confused emoticons expressing their Situation. This Diagram signifies the concept of frustration, fuddle, mess up, mislead, mortify, muddle, mystify, obscure, perplex, perturb, puzzle, shame, stir up, trouble, unhinge, unsettle, upset, and worry.
-
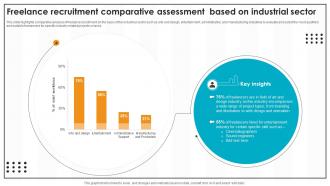 Freelance Recruitment Comparative Assessment Based On Industrial Sector
This slide highlights comparative analysis of freelance recruitment on the basis of the industrial sector such as arts and design, entertainment, administrative, and manufacturing industries to evaluate and select the most qualified and suitable freelancers for specific industry-related projects or tasks. Introducing our Freelance Recruitment Comparative Assessment Based On Industrial Sector set of slides. The topics discussed in these slides are Freelance Recruitment, Comparative Assessment, Industrial Sector. This is an immediately available PowerPoint presentation that can be conveniently customized. Download it and convince your audience.
-
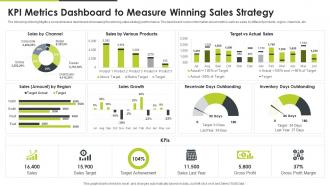 KPI Metrics Dashboard To Measure Winning Sales Strategy
The following slide highlights a comprehensive dashboard showcasing the winning sales strategy performance. The dashboard covers information about metrics such as sales by different products, region, channels, etc. Introducing our KPI Metrics Dashboard To Measure Winning Sales Strategy set of slides. The topics discussed in these slides are Sales Growth, Target Vs Actual Sales, Target Achievement. This is an immediately available PowerPoint presentation that can be conveniently customized. Download it and convince your audience.
-
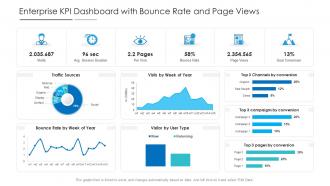 Enterprise kpi dashboard with bounce rate and page views powerpoint template
This Enterprise KPI Dashboard With Bounce Rate And Page Views Powerpoint Template is designed using a data-driven approach to help you display important stats, figures, insights, and metrics related to the topic of your choice. You can also deploy this slide to present reports on a specific business project and strategy. It is tailor-made using a mix of KPIs that make the information easily understandable. Project managers, executives, or other department heads can grab this readily available PowerPoint presentation slide to present relevant information. It can be further used for monitoring and identifying various trends doing rounds in the industry of your choice. The biggest feature of this PowerPoint layout is that it is designed using vector-based and high-quality graphics that can be reproduced as PNGs, JPGs, and PDFs. It also works well with Google Slides and PowerPoint. Therefore, giving a lot of options to work with.
-
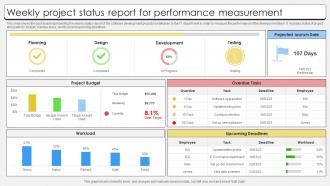 Weekly Project Status Report For Performance Measurement
This slide shows the dashboard representing the weekly status report of the software development projects undertaken by the IT department in order to measure the performance of the development team. It includes status of project along with its budget, overdue tasks, workload and upcoming deadlines. Introducing our Weekly Project Status Report For Performance Measurement set of slides. The topics discussed in these slides are Weekly Project, Status Report, For Performance, Measurement. This is an immediately available PowerPoint presentation that can be conveniently customized. Download it and convince your audience.
-
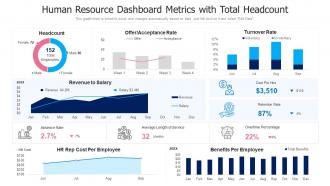 Human resource dashboard metrics with total headcount
Presenting our well-structured Human Resource Dashboard Metrics With Total Headcount. The topics discussed in this slide are Human Resource Dashboard Metrics With Total Headcount. This is an instantly available PowerPoint presentation that can be edited conveniently. Download it right away and captivate your audience.
-
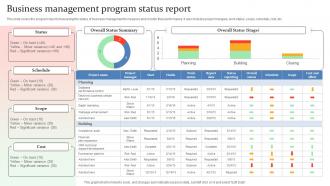 Business Management Program Status Report
This slide covers the program report showcasing the status of business management to measure and monitor their performance. It also includes project mangers, work status, scope, schedule, cost, etc. Presenting our well structured Business Management Program Status Report. The topics discussed in this slide are Overall Status Summary, Work Status.This is an instantly available PowerPoint presentation that can be edited conveniently. Download it right away and captivate your audience.
-
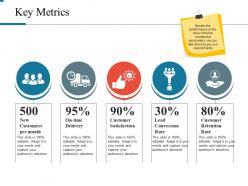 Key metrics powerpoint slide background designs
Presenting key metrics powerpoint slide background designs. This is a key metrics powerpoint slide background designs. This is a five stage process. The stages in this process are new customers per month, on time delivery, customer satisfaction, lead conversion rate, customer retention rate.
-
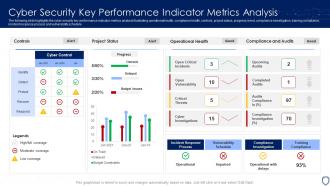 Cyber Security Key Performance Indicator Metrics Analysis
The following slide highlights the cyber security key performance indicator metrics analysis illustrating operational health, compliance health, controls, project status, progress, trend, compliance investigation, training compliance, incident response process and vulnerability schedule. Presenting our well structured Cyber Security Key Performance Indicator Metrics Analysis. The topics discussed in this slide are Incident Response Process, Vulnerability Schedule, Training Compliance. This is an instantly available PowerPoint presentation that can be edited conveniently. Download it right away and captivate your audience.
-
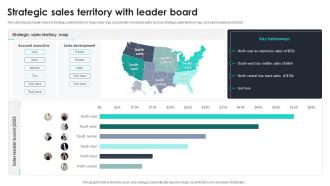 Strategic Sales Territory With Leader Board
This slide depicts leader board of strategic sales territory to keep sales reps accountable. It includes parts such as strategic sales territory map, and sales leader board 2023. Introducing our Strategic Sales Territory With Leader Board set of slides. The topics discussed in these slides are Strategic Sales Territory Map, Account Executive, Sales Development. This is an immediately available PowerPoint presentation that can be conveniently customized. Download it and convince your audience.
-
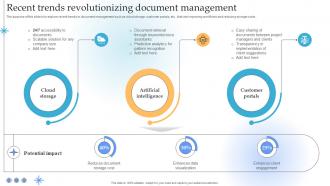 Recent Trends Revolutionizing Document Management
The purpose of this slide is to explore recent trends in document management such as cloud storage, customer portals, etc., that are improving workflows and reducing storage costs. Presenting our well structured Recent Trends Revolutionizing Document Management. The topics discussed in this slide are Artificial Intelligence, Customer Portals, Cloud Storage, Recent Trends Revolutionizing, Document Management. This is an instantly available PowerPoint presentation that can be edited conveniently. Download it right away and captivate your audience.
-
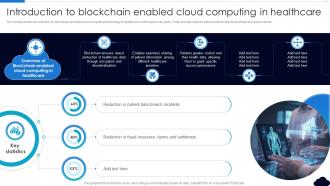 Introduction To Blockchain Enabled Cloud Computing In Healthcare Complete Guide To Blockchain BCT SS V
This slide provides an overview of blockchain enabled cloud computing technology in healthcare sector and its key facts. Facts include reduced data breach incidents and fraud insurance claims. Present the topic in a bit more detail with this Introduction To Blockchain Enabled Cloud Computing In Healthcare Complete Guide To Blockchain BCT SS V. Use it as a tool for discussion and navigation on Introduction To Blockchain Enabled, Cloud Computing In Healthcare, Data Breach Incidents. This template is free to edit as deemed fit for your organization. Therefore download it now.
-
 Historical Growth Trend Of Marketing Technology Solutions Marketing Technology Stack Analysis
Mentioned slide provide information about global available marketing technologies growth over the years. It includes key components such as years of growth, number of marketing solutions, and key insights. Present the topic in a bit more detail with this Historical Growth Trend Of Marketing Technology Solutions Marketing Technology Stack Analysis Use it as a tool for discussion and navigation on Historical Growth Trend, Marketing Technology Solutions This template is free to edit as deemed fit for your organization. Therefore download it now.
-
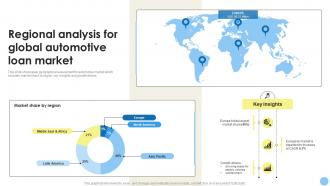 Regional Analysis For Global Automotive Loan Market Global Consumer CRP DK SS
This slide showcases geographical assessment for automotive market which includes market share by region, key insights and growth drivers. Deliver an outstanding presentation on the topic using this Regional Analysis For Global Automotive Loan Market Global Consumer CRP DK SS. Dispense information and present a thorough explanation of Market Share, Growth Drivers, Expected To Increase using the slides given. This template can be altered and personalized to fit your needs. It is also available for immediate download. So grab it now.
-
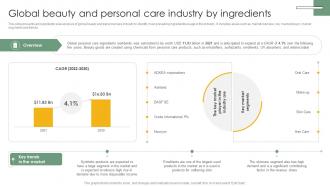 Global Beauty And Personal Cosmetic And Personal Care Market Trends Analysis IR SS V
This slide presents an ingredients wise analysis of global beauty and personal care industry to identify main prevailing ingredients usage in the industry. It includes areas such as market overview, key market player, market segments and trends. Present the topic in a bit more detail with this Global Beauty And Personal Cosmetic And Personal Care Market Trends Analysis IR SS V. Use it as a tool for discussion and navigation on Synthetic Products, Revenue Share, Skincare Segment. This template is free to edit as deemed fit for your organization. Therefore download it now.
-
 US Tobacco Market With Key Smoking Industry Report IR SS V
The slide highlights the US tobacco market with insights which further leverage them in taking strategic decisions. The slide covers the statistics for both. The slide covers market for smokeless tobacco market, cigars, NGP etc. Deliver an outstanding presentation on the topic using this US Tobacco Market With Key Smoking Industry Report IR SS V. Dispense information and present a thorough explanation of Tobacco Market, Novel Products, Customer Preferences using the slides given. This template can be altered and personalized to fit your needs. It is also available for immediate download. So grab it now.
-
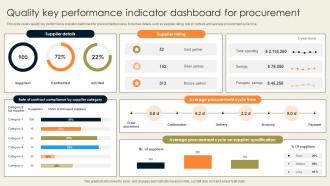 Quality Key Performance Indicator Dashboard Snapshot For Procurement
This slide covers quality key performance indicator dashboard Snapshot for procurement process. It involves details such as supplier rating, rate of contract and average procurement cycle time. Presenting our well structured Quality Key Performance Indicator Dashboard For Procurement. The topics discussed in this slide are Supplier Details, Supplier Rating, Average Procurement Cycle Time. This is an instantly available PowerPoint presentation that can be edited conveniently. Download it right away and captivate your audience.
-
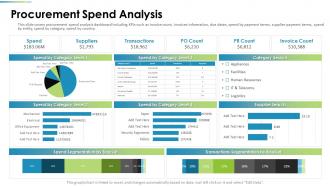 Procurement Analysis Procurement Spend Analysis Ppt Topics
This slide covers procurement spend analysis dashboard including KPIs such as invoice count, invoices information, due dates, spend by payment terms, supplier payment terms, spend by entity, spend by category, spend by country. Present the topic in a bit more detail with this Procurement Analysis Procurement Spend Analysis Ppt Topics. Use it as a tool for discussion and navigation on Procurement Spend Analysis. This template is free to edit as deemed fit for your organization. Therefore download it now.
-
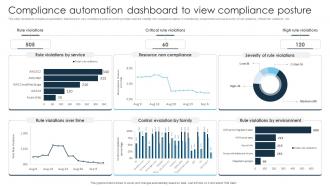 Compliance Automation Dashboard To View Compliance Posture
This slide represents compliance automation dashboard to view compliance posture which provides real time visibility into compliance status. It includes key components such as severity of rule violations, critical role violations, etc. Presenting our well structured Compliance Automation Dashboard To View Compliance Posture. The topics discussed in this slide are Compliance Automation Dashboard, View Compliance Posture, Critical Role Violations. This is an instantly available PowerPoint presentation that can be edited conveniently. Download it right away and captivate your audience.
-
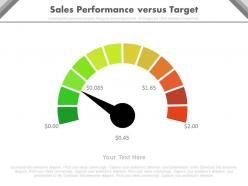 Ppt sales performance versus target indicator dial dashboard powerpoint slides
High resolution Dial Dashboard Diagram doesn’t pixel ate, while being projected on big screen. Easy to embed company logo/ trademark. Well compatible with Google slides. Quick and easy downloading process. Amendable font style, design and the content of the icons or the PPT Slides. Valuable for entrepreneurs, students, researchers and employees.
-
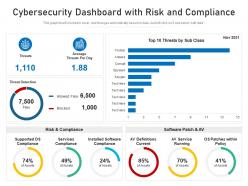 Cybersecurity dashboard with risk and compliance
Introducing our Cybersecurity Dashboard With Risk And Compliance set of slides. The topics discussed in these slides are Services Compliance, Threat Detection, Risk And Compliance. This is an immediately available PowerPoint presentation that can be conveniently customized. Download it and convince your audience.
-
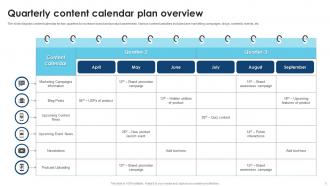 Quarterly Content Calendar Plan Overview
The slide displays content calendar for two quarters to increase brand and product awareness. Various content activities included are marketing campaigns, blogs, contests, events, etc. Introducing our Quarterly Content Calendar Plan Overviewset of slides. The topics discussed in these slides are Marketing Campaigns, Blogs, Contests, Events. This is an immediately available PowerPoint presentation that can be conveniently customized. Download it and convince your audience.
-
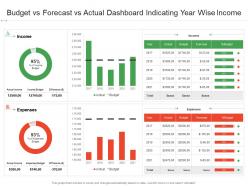 Budget vs forecast vs actual dashboard indicating year wise income
Introducing our Budget Vs Forecast Vs Actual Dashboard Indicating Year Wise Income set of slides. The topics discussed in these slides are Income, Expenses. This is an immediately available PowerPoint presentation that can be conveniently customized. Download it and convince your audience.
-
 Sales Volume Bike Production Enterprise Profile CP SS V
This slide outlines sales volume that showcases the performance of a number of units sold of models with engine capacity upto 350cc by Royal Enfield company for five consecutive years, i.e. from FY2022-23 to FY2018-19. Deliver an outstanding presentation on the topic using this Sales Volume Bike Production Enterprise Profile CP SS V. Dispense information and present a thorough explanation of Sales Volume, Consecutive Years, Sales Data using the slides given. This template can be altered and personalized to fit your needs. It is also available for immediate download. So grab it now.
-
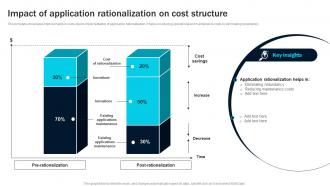 Impact Of Application Rationalization On Cost Structure
This template showcases improvements in costs due to implementation of application rationalization. It helps in reducing operational and maintenance costs by eliminating redundancy. Introducing our Impact Of Application Rationalization On Cost Structure set of slides. The topics discussed in these slides are Existing Applications Maintenance, Eliminating Redundancy, Reducing Maintenance Costs. This is an immediately available PowerPoint presentation that can be conveniently customized. Download it and convince your audience.
-
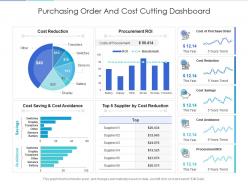 Purchasing order and cost cutting dashboard Snapshot powerpoint template
If you are looking for a perfect template to display metrics and insights, then this template titled Purchasing Order And Cost Cutting Dashboard Snapshot Powerpoint Template is the best choice. Deploy this PowerPoint presentation slide to evaluate the status of a campaign or identify different trends that affect the working culture of your organization. It offers a well-structured layout with many graphical representations to display real-time information. Our PPT slide can also be used as a measurement and comparison tool to weigh in different prospects in achieving your end goal. Additionally, this is a very useful set to share with higher authorities to help them make informed decisions based on analytical data and insights. The biggest advantage of this PowerPoint layout is that it has built-in features and graphics that make it easy to modify. Therefore, grab it now.


