Dashboard PowerPoint Slides, KPi Dashboard PPT Templates
- Sub Categories
-
- 30 60 90 Day Plan
- About Us Company Details
- Action Plan
- Agenda
- Annual Report
- Audit Reports
- Balance Scorecard
- Brand Equity
- Business Case Study
- Business Communication Skills
- Business Plan Development
- Business Problem Solving
- Business Review
- Capital Budgeting
- Career Planning
- Change Management
- Color Palettes
- Communication Process
- Company Location
- Company Vision
- Compare
- Competitive Analysis
- Corporate Governance
- Cost Reduction Strategies
- Custom Business Slides
- Customer Service
- Dashboard
- Data Management
- Decision Making
- Digital Marketing Strategy
- Digital Transformation
- Disaster Management
- Diversity
- Equity Investment
- Financial Analysis
- Financial Services
- Financials
- Growth Hacking Strategy
- Human Resource Management
- Innovation Management
- Interview Process
- Knowledge Management
- Leadership
- Lean Manufacturing
- Legal Law Order
- Management
- Market Segmentation
- Marketing
- Media and Communication
- Meeting Planner
- Mergers and Acquisitions
- Metaverse
- Newspapers
- Operations and Logistics
- Organizational Structure
- Our Goals
- Performance Management
- Pitch Decks
- Pricing Strategies
- Process Management
- Product Development
- Product Launch Ideas
- Product Portfolio
- Project Management
- Purchasing Process
- Quality Assurance
- Quotes and Testimonials
- Real Estate
- Risk Management
- Sales Performance Plan
- Sales Review
- SEO
- Service Offering
- Six Sigma
- Social Media and Network
- Software Development
- Solution Architecture
- Stock Portfolio
- Strategic Management
- Strategic Planning
- Supply Chain Management
- Swimlanes
- System Architecture
- Team Introduction
- Testing and Validation
- Thanks-FAQ
- Time Management
- Timelines Roadmaps
- Value Chain Analysis
- Value Stream Mapping
- Workplace Ethic
-
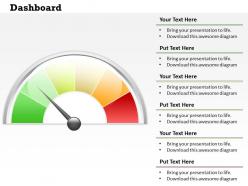 0314 dashboard visual iinformation design
Quick and basic download presentation slides. Completely editable PowerPoint template content according to your need. Totally modifiable PPT infographics-change colors, differentiation, size and introduction. Embed your own organization logo, slogan, trademark and so on to give a customized look. No adjustment in unique determination of PPT pictures in the wake of altering. Include flawlessly anyplace between your slides. Excel linked design so you can make changes in the excel sheet and the design will change accordingly.
-
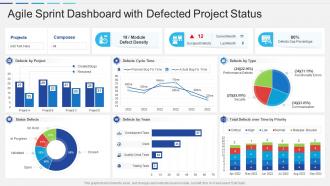 Agile sprint dashboard snapshot with defected project status
Introducing our Agile Sprint Dashboard Snapshot With Defected Project Status set of slides. The topics discussed in these slides are Team, Projects, Planned. This is an immediately available PowerPoint presentation that can be conveniently customized. Download it and convince your audience.
-
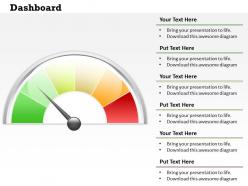 0314 dashboard visual iinformation design
Quick and basic download presentation slides. Completely editable PowerPoint template content according to your need. Totally modifiable PPT infographics-change colors, differentiation, size and introduction. Embed your own organization logo, slogan, trademark and so on to give a customized look. No adjustment in unique determination of PPT pictures in the wake of altering. Include flawlessly anyplace between your slides. Excel linked design so you can make changes in the excel sheet and the design will change accordingly.
-
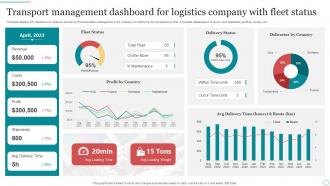 Transport Management Dashboard For Logistics Company With Fleet Status
This slide displays KPI dashboard to measure efficiency of transportation management in the company for optimizing its overall delivery time. It includes details about revenue, cost, shipments, profit by country, etc. Introducing our Transport Management Dashboard For Logistics Company With Fleet Status set of slides. The topics discussed in these slides are Profit By Country, Fleet Status, Delivery Status. This is an immediately available PowerPoint presentation that can be conveniently customized. Download it and convince your audience.
-
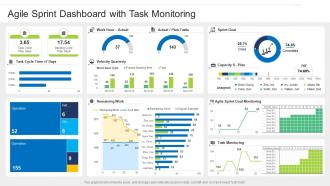 Agile sprint dashboard with task monitoring
Introducing our Agile Sprint Dashboard With Task Monitoring set of slides. The topics discussed in these slides are Plan, Goal, Product. This is an immediately available PowerPoint presentation that can be conveniently customized. Download it and convince your audience.
-
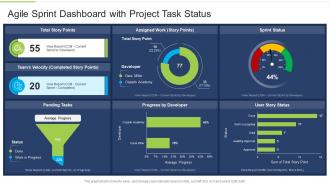 Agile sprint dashboard with project task status
Presenting our well structured Agile Sprint Dashboard With Project Task Status. The topics discussed in this slide are Average Progress, Team. This is an instantly available PowerPoint presentation that can be edited conveniently. Download it right away and captivate your audience.
-
 Project management agile sprint dashboard
Presenting our well structured Project Management Agile Sprint Dashboard. The topics discussed in this slide are Project, Planned. This is an instantly available PowerPoint presentation that can be edited conveniently. Download it right away and captivate your audience.
-
 0314 data driven dashboard style
High resolution graphics. PPT slide can be presented in both standard and widescreen view. Completely editable slide as colors, icons, and text can be change as per the need. Quick download. Effortless addition of company name, trademark/ logo. PPT templates are well-harmonized with Google slides. Excel linked design so you can make changes in the excel sheet and the design will change accordingly. Beneficial for business owners, marketers, shareholders, financiers, investors, entrepreneurs.
-
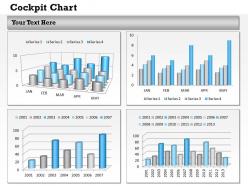 0314 data driven dashboard style
High resolution graphics. PPT slide can be presented in both standard and widescreen view. Completely editable slide as colors, icons, and text can be change as per the need. Quick download. Effortless addition of company name, trademark/ logo. PPT templates are well-harmonized with Google slides. Excel linked design so you can make changes in the excel sheet and the design will change accordingly. Beneficial for business owners, marketers, shareholders, financiers, investors, entrepreneurs.
-
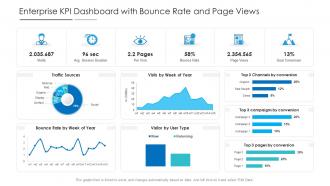 Enterprise kpi dashboard with bounce rate and page views powerpoint template
This Enterprise KPI Dashboard With Bounce Rate And Page Views Powerpoint Template is designed using a data-driven approach to help you display important stats, figures, insights, and metrics related to the topic of your choice. You can also deploy this slide to present reports on a specific business project and strategy. It is tailor-made using a mix of KPIs that make the information easily understandable. Project managers, executives, or other department heads can grab this readily available PowerPoint presentation slide to present relevant information. It can be further used for monitoring and identifying various trends doing rounds in the industry of your choice. The biggest feature of this PowerPoint layout is that it is designed using vector-based and high-quality graphics that can be reproduced as PNGs, JPGs, and PDFs. It also works well with Google Slides and PowerPoint. Therefore, giving a lot of options to work with.
-
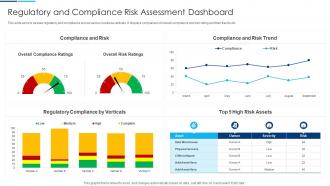 Regulatory And Compliance Risk Assessment Dashboard
This slide aims to assess regulatory and compliance across various business verticals. It displays comparison of overall compliance and risk rating and their trends etc. Introducing our Regulatory And Compliance Risk Assessment Dashboard set of slides. The topics discussed in these slides are Overall Compliance Ratings, Overall Risk Ratings, Compliance And Risk Trend. This is an immediately available PowerPoint presentation that can be conveniently customized. Download it and convince your audience.
-
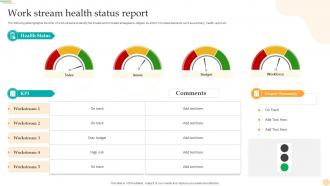 Work Stream Health Status Report
The following slide highlights the KPIs of work streams to identify the threats and formulate strategies to mitigate its effect. It includes elements such as summary, health report etc. Presenting our well-structured Work Stream Health Status Report. The topics discussed in this slide are Sales, Issues, Workforce, Budget. This is an instantly available PowerPoint presentation that can be edited conveniently. Download it right away and captivate your audience.
-
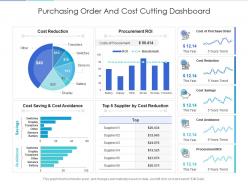 Purchasing order and cost cutting dashboard Snapshot powerpoint template
If you are looking for a perfect template to display metrics and insights, then this template titled Purchasing Order And Cost Cutting Dashboard Snapshot Powerpoint Template is the best choice. Deploy this PowerPoint presentation slide to evaluate the status of a campaign or identify different trends that affect the working culture of your organization. It offers a well-structured layout with many graphical representations to display real-time information. Our PPT slide can also be used as a measurement and comparison tool to weigh in different prospects in achieving your end goal. Additionally, this is a very useful set to share with higher authorities to help them make informed decisions based on analytical data and insights. The biggest advantage of this PowerPoint layout is that it has built-in features and graphics that make it easy to modify. Therefore, grab it now.
-
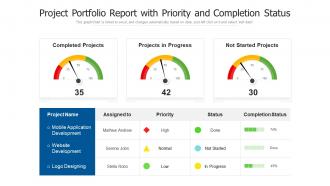 Project portfolio report with priority and completion status
This graph or chart is linked to excel, and changes automatically based on data. Just left click on it and select edit data. Introducing our premium set of slides with Project Portfolio Report With Priority And Completion Status. Elucidate the three stages and present information using this PPT slide. This is a completely adaptable PowerPoint template design that can be used to interpret topics like Completed Projects, Projects In Progress, Mobile Application Development. So download instantly and tailor it with your information.
-
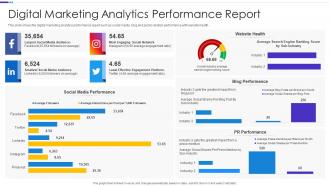 Digital Marketing Analytics Performance Report
This slide shows the digital marketing analytics performance report such as social media, blog and public relation performance with website health. Introducing our Digital Marketing Analytics Performance Report set of slides. The topics discussed in these slides are Social Media Performance, Website Health, Blog Performance. This is an immediately available PowerPoint presentation that can be conveniently customized. Download it and convince your audience.
-
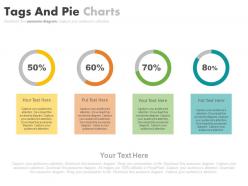 Four Staged Tags And Pie Charts Percentage Analysis Powerpoint Slides
Presenting four staged tags and pie charts percentage analysis powerpoint slides. This Power Point template slide has been crafted with graphic of four staged tags and pie charts. This PPT slide contains the concept of percentage analysis. Use this PPT slide for business and marketing related presentations.
-
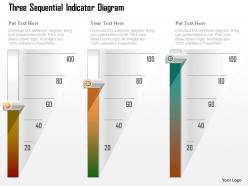 1214 three sequential indicator diagram powerpoint template
Very useful tool for marketing and business related presentations. Can be used by professionals working in marketing firm. Compatible with Google slides and other softwares. High def. graphics leave no scope for pixilation when projected on bigger screens. No space constraints which allow addition of titles. Customisable in terms of color and font size. Convertible into JPEG or PDF format
-
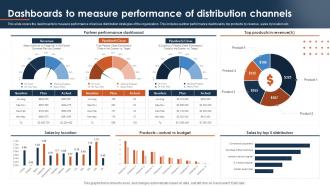 Dashboards To Measure Performance Multichannel Distribution System To Meet Customer Demand
This slide covers the dashboards to measure performance of various distribution strategies of the organization. This includes partner performance dashboards, top products by revenue, sales by location etc. Present the topic in a bit more detail with this Dashboards To Measure Performance Multichannel Distribution System To Meet Customer Demand. Use it as a tool for discussion and navigation on Partner Performance Dashboard, Top Products Revenue. This template is free to edit as deemed fit for your organization. Therefore download it now.
-
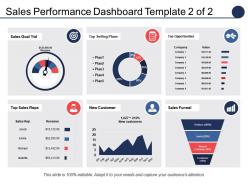 Sales Performance Dashboard Top Selling Plans Top Opportunities
Presenting sales performance dashboard top selling plans top opportunities PPT template. Completely amendable by any user at any point of time without any hassles. Error free performance to put an everlasting impression on the viewers. Great for incorporating business details such as name, logo and trademark. Can be utilized by students, entrepreneurs, investors and customers. Professionally designed presentation slides. Personalize the presentation with individual company name and logo. Available in both Standard and Widescreen slide size.
-
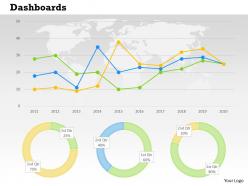 0314 dashboard for quantitative business data
High-resolution images and graphics in the slide icon. Offer instructions to modify the graphic layout. Instantly download and save in the format you like. Use it on online or the offline modes to make changes and design as per requirements. Completely editable slide design. Beneficial for the business entrepreneurs, professional marketers and the human resource managers.
-
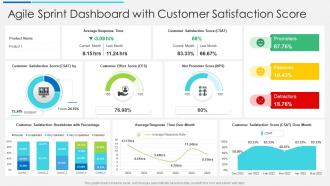 Agile sprint dashboard with customer satisfaction score
Presenting our well structured Agile Sprint Dashboard With Customer Satisfaction Score. The topics discussed in this slide are Average, Product, Customer. This is an instantly available PowerPoint presentation that can be edited conveniently. Download it right away and captivate your audience.
-
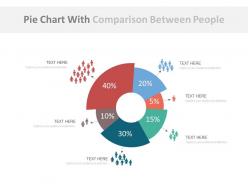 Pie chart with comparison between peoples powerpoint slides
Very useful for large companies and start-ups. Equally handy for school teachers for various subjects like geography, economics etc. Fully modifiable contents. PowerPoint templates available in widescreen format for different screen sizes. Easily convert PPT presentation to popular formats like JPG and PDF. Compatible with google slides for better usability. Uncomplicated process of changing icon features like Size, color and orientation.
-
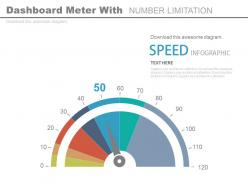 Dashboard Snapshot meter with number limitation powerpoint slides
Pre- made Presentation slide. Flexible option for conversion in PDF or JPG formats. Can use with Google slides. Colors, icons and text can be easily changed as the PPT slide is completely editable. Customize the presentation with business name and logo. Available in both Standard and Widescreen slide size. Quick download and easily shareable. Benefitted for business intelligence, data analysis, financial reporting, IT support, sales monitoring etc.
-
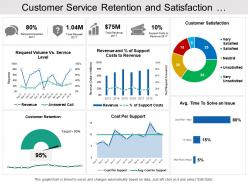 Customer service retention and satisfaction dashboard
Presenting this set of slides with name - Customer Service Retention And Satisfaction Dashboard. This is a six stage process. The stages in this process are Customer Base, Recurring Customers, Customer Services.
-
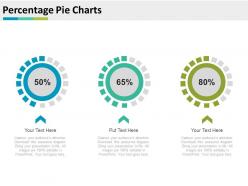 Percentage Pie Charts For Merger And Acquisitions Powerpoint Slides
Maintenance of overwhelming quality visuals all through the presentation. Compatible with wide screen yield. Can be satisfactorily used with any number of on the web and detached programming. The business slide outline is concordant with various courses of action decisions. Give it a more modified look with your association logo and name. Edit the PPT shape, tones, shade, substance and then some. Used by advancing guides, agents, advertisers, merchants, and business people.
-
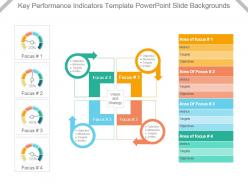 Key performance indicators template powerpoint slide backgrounds
Excellent use colors in the presentation template. Imaginatively created PowerPoint shape with modification options. Easily adjustable PPT slide as can be converted into JPG and PDF format. Conforming designs accessible to different nodes and stages. Great pixel quality as image quality remains relentless on every screen size. Choice to reveal slide in standard 4:3 widescreen 16:9 view. Presentation graphic suitable with Google slides. Fast download saves valuable time. Makes it easier to share the information with ease with large set of viewers. Easy to portray the KRAs related to the work.
-
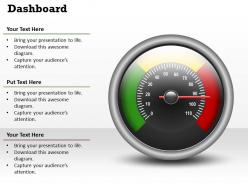 0314 dashboard business design slide
Allow editing or replacing of the icons. Provided instructions to change and edit the slide icon. Easy to download and save in the Jpg or PDF format. Access to open on a wide screen view. Offer to change the content, size, style and orientation of the slide icons. Useful for the sales professionals and the business learners and geography students.
-
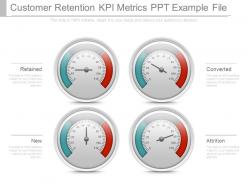 Customer retention kpi metrics ppt example file
Presenting customer retention kpi metrics ppt example file. This is a customer retention kpi metrics ppt example file. This is a four stage process. The stages in this process are retained, converted, new, attrition.
-
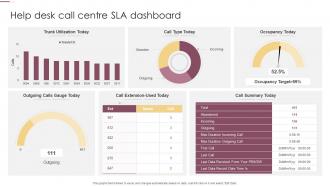 Help Desk Call Centre SLA Dashboard
Introducing our Help Desk Call Centre SLA Dashboard set of slides. The topics discussed in these slides are Occupancy Target, Trunk Utilization, Call Type. This is an immediately available PowerPoint presentation that can be conveniently customized. Download it and convince your audience.
-
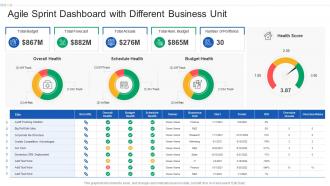 Agile sprint dashboard with different business unit
Presenting our well structured Agile Sprint Dashboard With Different Business Unit. The topics discussed in this slide are Budget, Portfolios, Cost. This is an instantly available PowerPoint presentation that can be edited conveniently. Download it right away and captivate your audience.
-
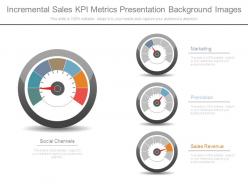 Incremental sales kpi metrics presentation background images
Presenting incremental sales kpi metrics presentation background images. This is a incremental sales kpi metrics presentation background images. This is a four stage process. The stages in this process are social channels, marketing, promotion, sales revenue.
-
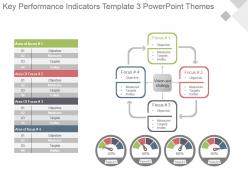 Key performance indicators template 3 powerpoint themes
Presenting key performance indicators template 3 powerpoint themes. This is a key performance indicators template 3 powerpoint themes. This is a four stage process. The stages in this process are objective, measures, targets, invites.
-
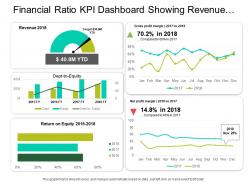 Financial ratio kpi dashboard showing revenue net profit margin and debt to equity
Presenting this set of slides with name - Financial Ratio Kpi Dashboard Showing Revenue Net Profit Margin And Debt To Equity. This is a five stage process. The stages in this process are Accounting Ratio, Financial Statement, Financial Ratio.
-
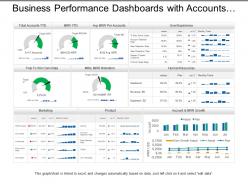 Business performance dashboards snapshot with accounts and mrr growth
Presenting, our business performance dashboards snapshot with accounts and mr growth PPT layout. High pixel resolution of the designs. Easy to edit and save using google slides. 100% modification of the slides granted. Apply your company name, replacing the official trademark in the slides. Valuable for the Marketing Professionals, business managers, and the directors. Includes extensive text spaces to include a title and can be easily projected to a widescreen.
-
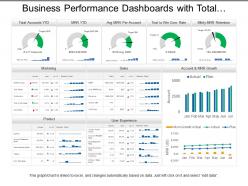 Business performance dashboards with total accounts marketing and product
Presenting, business performance dashboards with total accounts marketing and product PowerPoint template. High-resolution PPT slide to reflect on business performance. The content is accurate and ready to use. Modifiable framework, layout, and font type, font size, and color schemes. Can be quickly transformed into PDF and JPG format. Appealing graphs for illustration and captivating figures to illustrate the idea. Can be extended to widescreen without loss of quality. Compatible with Google Slides and widescreens.
-
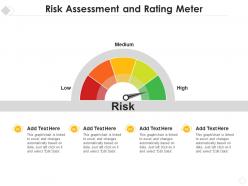 Risk assessment and rating meter
Presenting our set of slides with Risk Assessment And Rating Meter. This exhibits information on three stages of the process. This is an easy to edit and innovatively designed PowerPoint template. So download immediately and highlight information on Risk Assessment And Rating Meter.
-
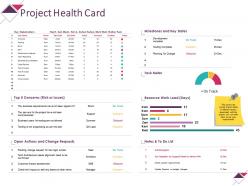 Project health card powerpoint slide information
Presenting this set of slides with name - Project Health Card Powerpoint Slide Information. This is a six stage process. The stages in this process are Task Meter, Resource Work Load, Open Actions And Change, Dashboard, Business.
-
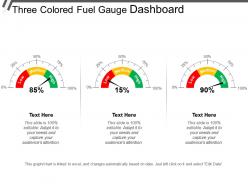 Three colored fuel gauge dashboard
Presenting this set of slides with name - Three Colored Fuel Gauge Dashboard. This is a three stage process. The stages in this process are Fuel Gauge, Gas Gauge, Fuel Containers.
-
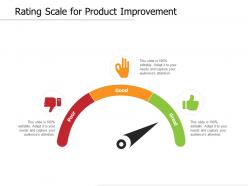 Rating scale for product improvement
Presenting this set of slides with name Rating Scale For Product Improvement. This is a three stage process. The stages in this process are Product Improvement, Rating Scale, Product Quality. This is a completely editable PowerPoint presentation and is available for immediate download. Download now and impress your audience.
-
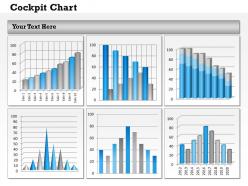 0314 dashboard to visualize business data
Painless proofing and change in attribute features in presentation visual. Presentation slide is useful in business marketing, management sales, and human resources management. Professional theme which supports alteration in font, color and layout. Interesting color scheme gives an executive look to PPT layout. Transformation into PDF or JPG formats is trouble free and effortless.
-
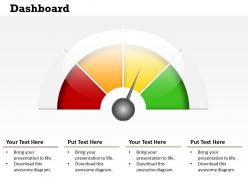 0314 dashboard design business theme
Pixel friendly images and graphics in the slide design. Easy to download and save in the format you like. Replace the content with your business information. Access to use with the Google Slides. Open on a wide screen view without any fear of pixelating. Beneficial for the strategy designers, doctors, patients and related staff.
-
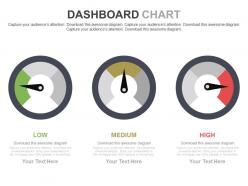 Three Meters Dashboard Charts For Analysis Powerpoint Slides
These designs create a never-ending connection between the presentation and the audience. For the Delivery of the Organisational objective these patterns act as a perfect medium. They are entirely editable. They can be viewed on big screens for more clarity and better vision. As an outcome the audience experience top notch quality presentations.
-
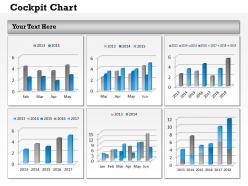 0314 display data in dashboard snapshot layout
Useful for manufacturing concerns and other multi-national companies. High resolution graphics prevent pixilation on bigger and wider screens. Small size layout is quick to download and compatible with Google slides. Runs with softwares and can accommodate company’s details with respect to trademarks, name or logo. Easily changeable into PDF and JPEG formats. No space constraints for adding titles and sub-titles.
-
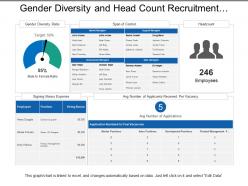 Gender diversity and head count recruitment dashboard
Presenting this set of slides with name - Gender Diversity And Head Count Recruitment Dashboard. This is a two stage process. The stages in this process are Staffing Plan, Recruitment, Staff Management.
-
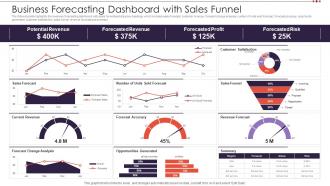 Business Forecasting Dashboard Snapshot With Sales Funnel
The following slide highlights the business forecasting dashboard snapshot with sales funnel illustrating key headings which includes sales forecast, customer revenue, forecast change analysis, number of units sold forecast, forecast accuracy, opportunity generated, customer satisfaction, sales funnel, revenue forecast and summary. Introducing our Business Forecasting Dashboard With Sales Funnel set of slides. The topics discussed in these slides are Potential Revenue, Forecasted Revenue, Forecasted Profit. This is an immediately available PowerPoint presentation that can be conveniently customized. Download it and convince your audience.
-
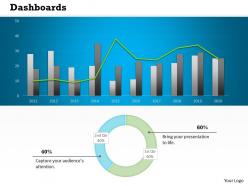 0314 Business Charts Dashboard Design
Supreme Quality PPT presentation layouts. Makes the entire information look interesting and relevant. Helps to make any comparisons ion order to make better decisions and strategies. Well matched framework with Google. Result and performance oriented PPT presentation layouts. Can fit into any presentation seamlessly. Allows widescreen view for enhanced vision. Completely amendable by the user by following simple instructions.
-
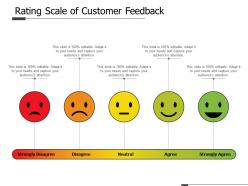 Rating scale of customer feedback
Presenting this set of slides with name Rating Scale Of Customer Feedback. This is a five stage process. The stages in this process are Product Improvement, Rating Scale, Product Quality. This is a completely editable PowerPoint presentation and is available for immediate download. Download now and impress your audience.
-
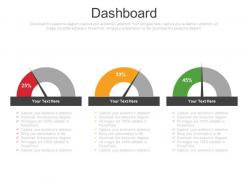 Three dashboard with percentage analysis powerpoint slides
High determination graphics. No issue of picture pixilation when anticipated on wide screen. Impressive arrangement of introduction point and slide content. Compatible with fluctuated number of on the web and disconnected programming alternatives. Modify the PPT symbol, shading, introduction, textual styles, and so on according to individual inclination. Hassle free altering conceivable. Freedom to customize the slide case with organization name and logo. Special rules for executing the progressions are given. Used by a few corporate experts from various areas, instructors and understudies.
-
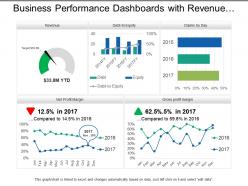 Business performance dashboards with revenue and ratios
Presenting, our business performance dashboards with revenue and ratios PPT deck. Pre-designed chart sheet directed PowerPoint Presentation template. Administration of high-resolution images, graphs, and comparison diagrams. Filled with methods and effects to create an impact. Can be quickly converted into JPEG/JPG or PDF formats as per the requirements. Congenial with Google Slides for ease. Project to widescreen without cringing about pixelating, after downloading explore these characteristics.
-
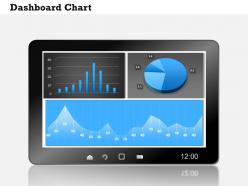 0314 dashboard business information chart
Easy to download and save in the format you like. Replace the content with your business information. Access to use with the Google Slides. Pixel friendly images and graphics in the slide design. Open on a wide screen view without any fear of pixelating. Useful for the business managers, sales professionals and the business learners and geography students.
-
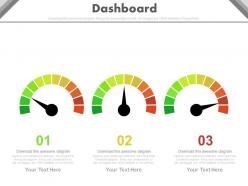 Three Dashboard Snapshot Charts For Business Data Powerpoint Slides
High caliber of pictures and symbols. Strikingly wonderful Presentation slide. Effectively amendable PowerPoint configuration as can be altered easily. Access to exhibit the PPT format in widescreen see. Versatile outlines as good with Google slides. Downloading is simple and can be changed into JPEG and PDF. Ideal for business moderators, administration and the business people.
-
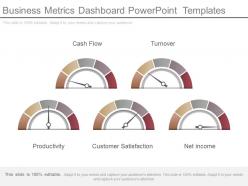 Business metrics dashboard powerpoint templates
Presenting business metrics dashboard PowerPoint templates. Simple to use PowerPoint template layout Demonstrate it with professional details name and image of the establishment. Text, font, colors and orientation can be transformed as per the preference. Familiar with software’s such as JPG and PDF and also with Google slides. Genuine high resolution PPT slide stays even after customization. Easy to download and share at any location. Hundred percent editable Presentation graphic is available with different portray options i.e. standard and widescreen view.
-
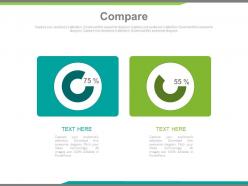 Comparison Charts With Percentage Powerpoint Slides
Presenting, comparison charts with the percentage of PowerPoint slides. Adjust the infographics according to your data. Personalize the percentage value and color schemes. Convenient and fast to download with ease. Adjust the size and orientation of presentation infographics to your liking. Alter the text to suit the context. Include your own logo, company mane, trademark, brand-name etc. No alteration in original high resolution of PPT images after editing. Convert into JPEG/PDF as per requirement.
-
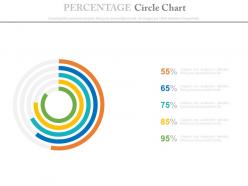 Five stage percentage circle chart powerpoint slides
High resolution PPT example for Technology Vision. Wide screen projection does not affect the output adversely. Easy to edit and customize colorful PPT graphics. Precise and easy to comprehend information on PPT sample. Increase the level of personalization with your company logo and name. Compatible with all software and can be saved in any format. Useful for business analysts, finance experts, accounts specialists, sales team.
-
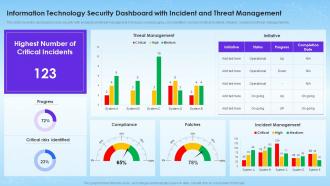 Information Technology Security Dashboard With Incident And Threat Management
This slide shows the dashboard of cyber security with incidents and threat management. It includes overall progress, risk identified , number of critical incidents, initiative , incident and threat management etc. Introducing our Information Technology Security Dashboard With Incident And Threat Management set of slides. The topics discussed in these slides are Threat Management, Incident Management, Critical Risks Identified. This is an immediately available PowerPoint presentation that can be conveniently customized. Download it and convince your audience.
-
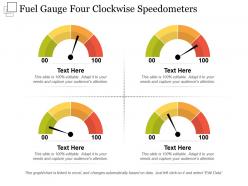 Fuel gauge four clockwise speedometers
Presenting this set of slides with name - Fuel Gauge Four Clockwise Speedometers. This is a four stage process. The stages in this process are Fuel Gauge, Gas Gauge, Fuel Containers.
-
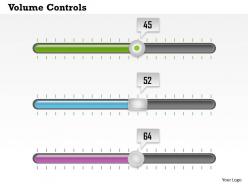 0614 business consulting diagram graphics of volume controls powerpoint slide template
High resolution visuals which do not deter in quality when projected on wide screen. Impressive use of images, text, colors and shapes. Ease of download. Save it in any desired format like JPEG, JPG or PNG. Compatible with Google slides, Windows and Mac. Compatible with numerous software options. Ease of executing changes in this thoroughly editable slide design. Freedom to customize and personalize the presentation with company specific name and logo.
-
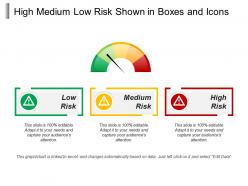 High medium low risk shown in boxes and icons
Presenting this set of slides with name - High Medium Low Risk Shown In Boxes And Icons. This is a three stage process. The stages in this process are High Medium Low, High Moderate Low, Top Medium Low.
-
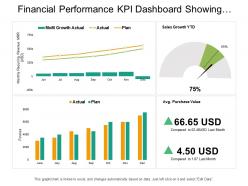 Financial performance kpi dashboard showing sales growth average purchase value
Presenting this set of slides with name - Financial Performance Kpi Dashboard Showing Sales Growth Average Purchase Value. This is a three stage process. The stages in this process are Financial Performance, Financial Report, Financial Review.
-
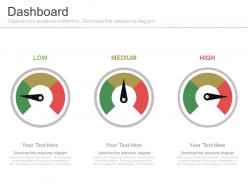 Three dashboard meters with low medium and high mode powerpoint slides
All images are 100% editable in the presentation design. Good quality images can be used to compliment and reinforce message. Works well in Windows 7, 8, 10, XP, Vista and Citrix. Editing in presentation slide show can be done from anywhere by any device. Elegant and beautiful presentation which can be oriented and customized according to requirement.


