- Sub Categories
-
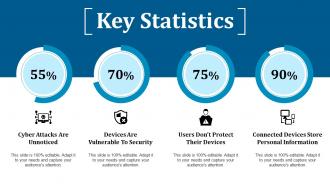 Key statistics ppt show deck
Presenting this set of slides with name - Key Statistics Ppt Show Deck. This is a four stage process. The stages in this process are Devices Are Vulnerable To Security, Users Dont Protect Their Devices, Cyber Attacks Are Unnoticed.
-
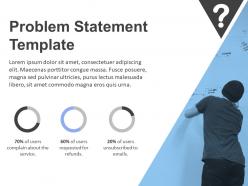 Problem Statement Template With Man Writing On Whiteboard And Data Driven Pie Charts
Presenting problem statement template with man writing on whiteboard and data driven pie charts. This is a problem statement template with man writing on whiteboard and data driven pie charts. This is a three stage process. The stages in this process are problem, business problem, research problem statement, business challenge, challenges.
-
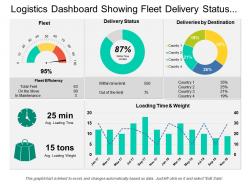 Logistics dashboard showing fleet delivery status and delivery by destination
Presenting this set of slides with name - Logistics Dashboard Showing Fleet Delivery Status And Delivery By Destination. This is a three stage process. The stages in this process are Logistics Dashboard, Logistics Kpis, Logistics Performance.
-
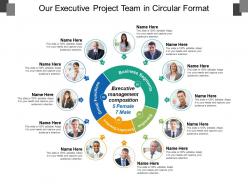 Our executive project team in circular format
• Impressive picture quality. • High resolution slide design. • Well crafted, aesthetically sound and professionally proficient. • Ease of download. • Ease of executing changes in the slide content. • Harmonious with multiple numbers of software options. • Harmonious with numerous slide design software. • Easy to customize and personalize with company specific name, logo and trademark. • Used by company professionals, teachers and students.
-
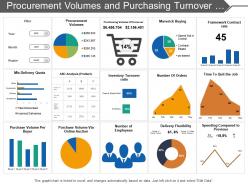 Procurement volumes and purchasing turnover dashboard
Presenting this set of slides with name - Procurement Volumes And Purchasing Turnover Dashboard. This is a four stage process. The stages in this process are Purchase, Procurement, Buy.
-
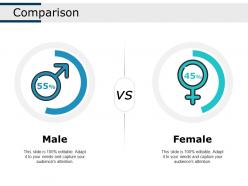 Comparison ppt show infographic template
Presenting this set of slides with name - Comparison Ppt Show Infographic Template. This is a two stage process. The stages in this process are Male, Female, Comparison.
-
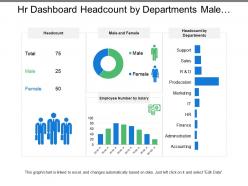 Hr dashboard headcount by departments male and female
Presenting this set of slides with name - Hr Dashboard Headcount By Departments Male And Female. This is a three stage process. The stages in this process are Hr Dashboard, Human Resource Dashboard, Hr Kpi.
-
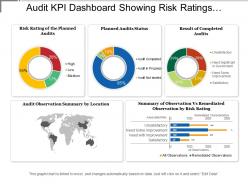 Audit kpi dashboard showing risk ratings planned audit status
Presenting this set of slides with name - Audit Kpi Dashboard Showing Risk Ratings Planned Audit Status. This is a five stage process. The stages in this process are Audit, Examine, Survey.
-
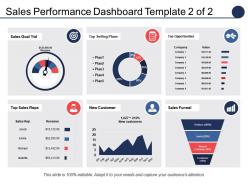 Sales Performance Dashboard Top Selling Plans Top Opportunities
Presenting sales performance dashboard top selling plans top opportunities PPT template. Completely amendable by any user at any point of time without any hassles. Error free performance to put an everlasting impression on the viewers. Great for incorporating business details such as name, logo and trademark. Can be utilized by students, entrepreneurs, investors and customers. Professionally designed presentation slides. Personalize the presentation with individual company name and logo. Available in both Standard and Widescreen slide size.
-
 Business development statistics results slide powerpoint templates
Presenting business development statistics results slide powerpoint templates. This is a business development statistics results slide powerpoint templates. This is a five stage process. The stages in this process are results, output, deliverables, goals.
-
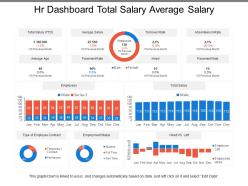 Hr dashboard total salary average salary
Presenting this set of slides with name - Hr Dashboard Total Salary Average Salary. This is a three stage process. The stages in this process are Hr Dashboard, Human Resource Dashboard, Hr Kpi.
-
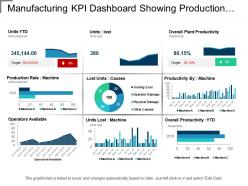 Manufacturing kpi dashboard showing production rate and lost units
Presenting manufacturing KPI dashboard showing production rate and lost units. This layout is compatible with Google slides and data can be updated with excel linked file. Easy to put in company logo, trademark or name; accommodate words to support the key points. Images do no blur out even when they are projected on large screen.PPT template can be utilized by sales and marketing teams and business managers. Instantly downloadable slide and supports formats like JPEG and PDF.
-
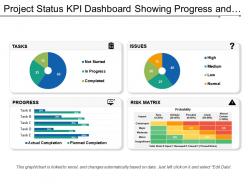 Project status kpi dashboard snapshot showing progress and risk matrix
Presenting project status KPI dashboard snapshot showing progress and risk matrix PowerPoint template. Simple data input like company logo, name or trademark. This PowerPoint theme is fully supported by Google slides. Picture quality of these slides does not change even when projected on large screen. This formats can be easily changed to JPEG and PDF applications. This template is suitable for marketing, sales persons, business managers and entrepreneurs. Adjust PPT layout, font, text and color as per your necessity
-
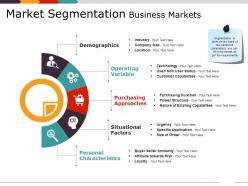 Market segmentation business markets ppt examples
Presenting Market Segmentation Business Markets PPT Examples PowerPoint slide. You can download and save this PowerPoint layout in different formats like PDF, PNG and JPG. This PPT theme is available in both 4:3 and 16:9 aspect ratios. As this PowerPoint template is 100% editable, you can modify color, font size, font type, and shapes as per your requirements. This PPT presentation is Google Slides compatible hence it is easily accessible.
-
 Human resources kpi dashboard showing employee number by salary staff composition
Presenting this set of slides with name - Human Resources Kpi Dashboard Showing Employee Number By Salary Staff Composition. This is a four stage process. The stages in this process are Human Resource, Hrm, Human Capital.
-
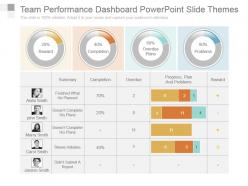 Team performance dashboard powerpoint slide themes
Presenting team performance dashboard powerpoint slide themes. This is a team performance dashboard powerpoint slide themes. This is a four stage process. The stages in this process are summary, completion, overdue, progress, plan and problems, reward, finished what he planned, doesnt complete his plans, doesnt complete his plans, shows initiative, didnt submit a report.
-
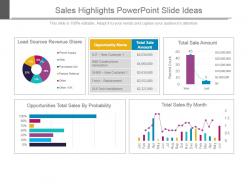 Sales highlights powerpoint slide ideas
Presenting sales highlights powerpoint slide ideas. This is a sales highlights powerpoint slide ideas. This is a five stage process. The stages in this process are lead sources revenue share, opportunity name, total sale amount, total sale amount, opportunities total sales by probability, total sales by month.
-
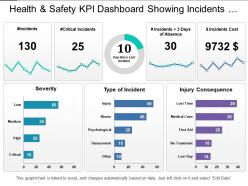 Health and safety kpi dashboard showing incidents severity and consequences
Presenting the health and safety PPT slide. This PPT slide is fully editable and is designed by professionals looking for a professional presentation. You can edit the objects in the slide like font size and font color easily. This presentation slide is fully compatible with Google Slide and can be saved in JPG or PDF file format easily. Click on the download button below.
-
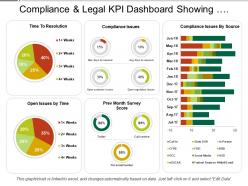 Compliance and legal kpi dashboard showing compliance issues and resolution time
Presenting this set of slides with name - Compliance And Legal Kpi Dashboard Showing Compliance Issues And Resolution Time. This is a three stage process. The stages in this process are Compliance And Legal, Legal Governance, Risk Management.
-
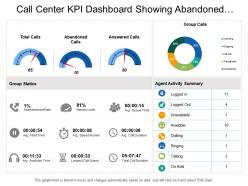 Call center kpi dashboard showing abandoned calls group calls group statistics
Presenting this set of slides with name - Call Center Kpi Dashboard Showing Abandoned Calls Group Calls Group Statistics. This is a four stage process. The stages in this process are Call Center Agent, Customer Care, Client Support.
-
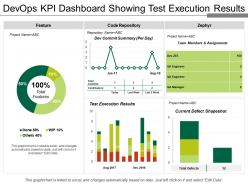 Devops kpi dashboard showing test execution results
Presenting this set of slides with the name DevOps Kpi Dashboard Showing Test Execution Results. This set of slides contains information about the important process of the DevOps Kpi dashboard that are Features, code repository, zephyr, Test execution results, and current defect Shapeshot. This is a completely editable PowerPoint presentation and is available for immediate download. Download now and impress your audience.
-
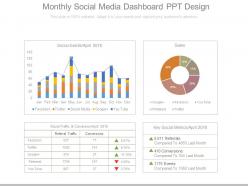 Monthly social media dashboard snapshot ppt design
Presenting monthly social media dashboard snapshot ppt design. This is a monthly social media dashboard ppt design. This is a four stage process. The stages in this process are social events, sales, social traffic and conversion, key social metrics, referrals, conversions, events.
-
 Comparison ppt file themes
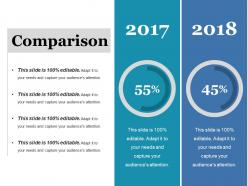
Presenting this set of slides with name - Comparison Ppt File Themes. This is a two stage process. The stages in this process are Finance, Business, Year, Comparison, Donut.
-
 Supply chain management kpi dashboard showing supplier compliance stats
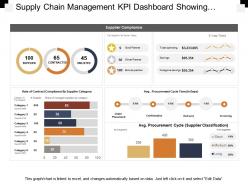
Presenting this set of slides with name - Supply Chain Management Kpi Dashboard Showing Supplier Compliance Stats. This is a four stage process. The stages in this process are Demand Forecasting, Predicting Future Demand, Supply Chain Management.
-
 Doughnut chart for data visualization comparison of percentages powerpoint slides design
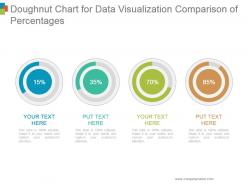
Presenting doughnut chart for data visualization comparison of percentages powerpoint slides design. This is a doughnut chart for data visualization comparison of percentages powerpoint slides design. This is a four stage process. The stages in this process are business, marketing, financial, percentage, increase.
-
 Risk Management Kpi Dashboard Showing Incidents By Priority And Severity
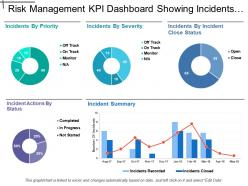
Presenting this set of slides with name - Risk Management Kpi Dashboard Showing Incidents By Priority And Severity. This is a four stage process. The stages in this process are Risk Management, Risk Assessment, Project Risk.
-
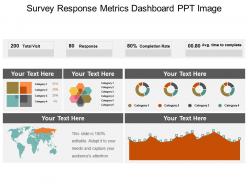 Survey response metrics dashboard snapshot ppt image
Presenting survey response metrics dashboard snapshot PPT image PPT presentation which is 100% editable. This PPT template is crafted with attractive display and unique components. This PPT slide is easy to customize and enables you to personalize it as per your own criteria. The presentation slide is fully compatible with Google slides, multiple format and software options. In case of any assistance, kindly take instructions from our presentation design services and it is easy to download in a very short span of time. The images, layouts, designs are of high quality and ensures quality in widescreen.
-
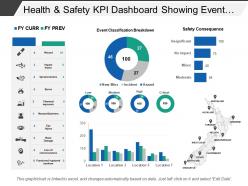 Health and safety kpi dashboard showing event classification breakdown
Presenting the modern dashboard PPT template. This dashboard PPT design is 100% editable and is created by professionals. You can bring changes to the objects in the template like font size and font color very easily. This presentation slide is fully compatible with Google Slide and can be saved in JPG or PDF file format without any hassle. Fast download this at the click of the button.
-
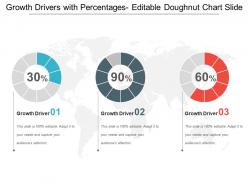 Growth drivers with percentages editable doughnut chart slide
Presenting a PPT template named Growth drivers with percentages editable doughnut chart slide. This template is professionally designed and is completely editable. The Font color, Font size, Font style, background color and color of the diagram can be altered as per your suitability. The text in the template can be rewritten and replaced with your desired content. The slide is totally compatible with Google slides and can be easily saved in JPG or PDF format. You can customize the template conveniently by changing the data in excel sheet, as this template is Excel-linked. Editable icons make the presentation more presentable. Download it now to make a hassle free presentation.
-
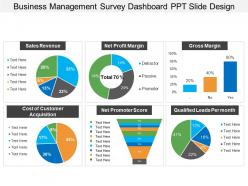 Business management survey dashboard snapshot ppt slide design
Presenting business management survey dashboard snapshot PPT slide design PowerPoint diagram which is 100% editable. This PPT template is data driven i.e. excel linked and is easy to customize and enables you to personalize it as per your own criteria. The presentation slide is fully compatible with Google slides, multiple format and software options. In case of any assistance, kindly take instructions from our presentation design services and it is easy to download in a very short span of time. The images, layouts, designs are of high quality and ensures quality in widescreen.
-
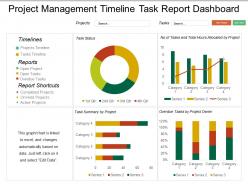 Project management timeline task report dashboard snapshot
Introducing project management timeline task report dashboard snapshot PPT template. An easy access to make the desired changes or edit it anyways. Wide screen view of the slides. Easy conversion into Jpeg or Pdf format. The PPT images offer compatibility with Google Slides. High resolution icons for clear message delivery. Unique and informational content. Valuable for business professionals, sales representatives, marketing professionals, students and selling investigators. High quality charts and visuals used in the designing process. They enhance the performance of the presentation.
-
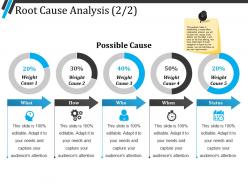 Root cause analysis ppt summary
Presenting Root Cause Analysis PPT Summary which is designed professionally for your convenience. You can change the color, fonts, font size, and font types of the template as per the requirements. The slide is readily available in both 4:3 and 16:9 aspect ratio. It is adaptable with Google Slides which makes it accessible at once. Can be converted into formats like PDF, JPG, and PNG.
-
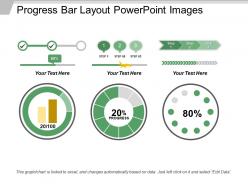 Progress bar layout powerpoint images
You can download this PPT completely free of cost. You just have to edit the data in a pre-designed format and present it. You can insert fonts and icons to this ready-made slide. All these slides are fully compatible with Google Slides. This presentation can be downloaded in JPG and PDF formats. It can be viewed in the 16:9 ratio widescreen size and the ratio of 4:3 standard screen size.
-
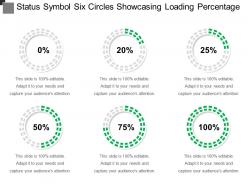 Status symbol six circles showcasing loading percentage
Presenting status symbol six circles showcasing loading percentage. This is a status symbol six circles showcasing loading percentage. This is a six stage process. The stages in this process are status symbol, status icon.
-
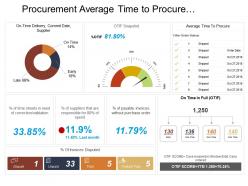 Procurement average time to procure dashboard
Presenting this set of slides with name - Procurement Average Time To Procure Dashboard. This is a seven stage process. The stages in this process are Purchase, Procurement, Buy.
-
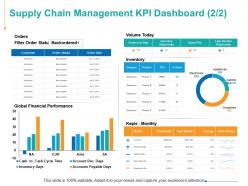 Supply chain management kpi dashboard finance ppt powerpoint presentation files
Presenting this set of slides with name - Supply Chain Management KPI Dashboard Finance Ppt Powerpoint Presentation Files. This is a four stage process. The stages in this process are Customer, Inventory, Marketing, Strategy, Planning.
-
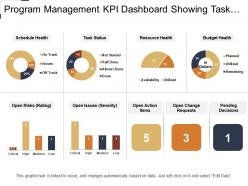 Program management kpi dashboard showing task status and budget health
Presenting Program Management KPI Dashboard Showing Task Status And Budget Health PPT slide. The task status dashboard PowerPoint template designed professionally by the team of SlideTeam to present the current status of the project. The different icons such as pie chart, semi-circle, square box, line chart and many other which include text in the Budget health dashboard slide are customizable in PowerPoint. A user can populate the pie chart and line chart values by editing the excel table and it is also compatible with Google Slide. A user can alter the font size, font type, color and dimensions of the line chart and pie chart to show the desired values.
-
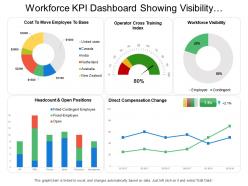 Workforce kpi dashboard showing visibility headcount and direct compensation change
Presenting this set of slides with name - Workforce Kpi Dashboard Showing Visibility Headcount And Direct Compensation Change. This is a five stage process. The stages in this process are Staff, Personnel, Workforce.
-
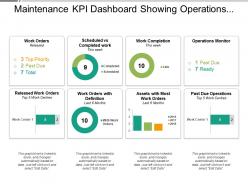 Maintenance kpi dashboard showing operations monitor and past due operations
Presenting this set of slides with name - Maintenance Kpi Dashboard Showing Operations Monitor And Past Due Operations. This is a three stage process. The stages in this process are Maintenance, Preservation, Conservation.
-
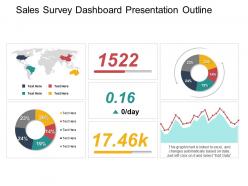 Sales survey dashboard snapshot presentation outline
Presenting sales survey dashboard snapshot presentation outline. The slideshow is fully flexible. You can incorporate them into any PowerPoint without worrying about compatibilities. It is fully compatible with Google Slides and Microsoft PowerPoint. Except this, you will get full versatility. PPT can be downloaded into JPEG and PDF formats. You can modify and personalize the design the way you want. All the design elements are 100% editable.
-
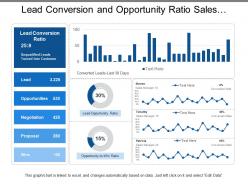 Lead conversion and opportunity ratio sales dashboards
Presenting this set of slides with name - Lead Conversion And Opportunity Ratio Sales Dashboards. This is a four stage process. The stages in this process are Sales Dashboard, Sales Kpis, Sales Performance.
-
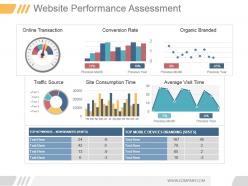 Website performance assessment powerpoint ideas
Presenting website performance assessment powerpoint ideas. This is a website performance assessment powerpoint ideas. This is a three stage process. The stages in this process are online transaction, conversion rate, organic branded, traffic, source, site consumption time, average visit time, previous month, previous year, top keywords non branded visits, top mobile devices branding visits.
-
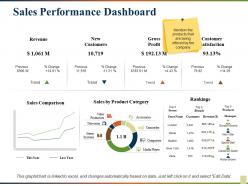 Sales performance dashboard
Presenting this set of slides with name - Sales Performance Dashboard. This is a seven stage process. The stages in this process are Revenue, New Customers, Gross Profit, Customer Satisfaction, Rankings .
-
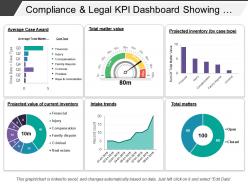 Compliance and legal kpi dashboard showing total matter value
Presenting this set of slides with name - Compliance And Legal Kpi Dashboard Showing Total Matter Value. This is a six stage process. The stages in this process are Compliance And Legal, Legal Governance, Risk Management.
-
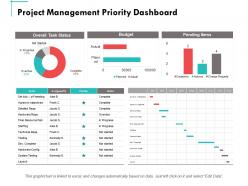 Project management priority dashboard ppt powerpoint presentation summary slide download
Presenting this set of slides with name - Project Management Priority Dashboard Ppt Powerpoint Presentation Summary Slide Download. This is a two stages process. The stages in this process are Finance, Marketing, Management, Investment, Analysis.
-
 Project Management Dashboard Budget By Employee
Presenting this set of slides with name - Project Management Dashboard Budget By Employee. This is a one stage process. The stages in this process are Percentage, Product, Marketing, Management, Business.
-
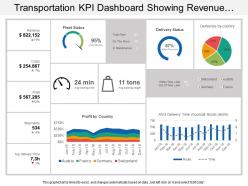 Transportation kpi dashboard snapshot showing revenue costs profit fleet status
Presenting KPI dashboard snapshot showing revenue costs profit fleet status slideshow. Change PowerPoint structure, font, text, color and design as per your requirements. Easy to input data with excel linked charts, just right to click to input data. This presentation theme is totally attuned with Google slides. Easy conversion to other software’s like JPG and PDF formats. Image quality of these PPT diagram remains the unchanged even when you resize the image or portray on large screens.
-
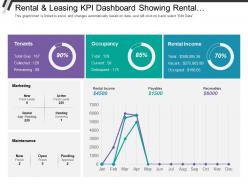 Rental and leasing kpi dashboard showing rental income occupancy tenants
As this PPT presentation is fully editable you change the size, orientation and color of the various graphical illustrations used in the pre-designed slides. You can edit the font size, font color and even the font style of the text used here. After you download the slideshow you can view it in standard size display ratio of 4:3 or widescreen display ratio of 16:9 conveniently. Any changes that you need to make can be made following instructions given in the sample slides.
-
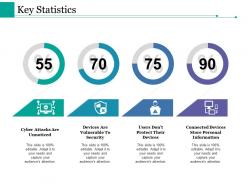 Key statistics ppt styles layout
Presenting this set of slides with name - Key Statistics Ppt Styles Layout. This is a four stage process. The stages in this process are Cyber Attacks Are Unnoticed, Devices Are Vulnerable To Security, Users Don T Protect Their Devices, Connected Devices Store Personal Information.
-
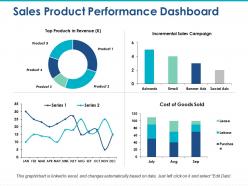 Sales product performance dashboard incremental sales campaign
Providing sales product performance dashboard incremental sales campaign presentation template with editing preference as images, icons, colors, text and layout can be edit as required. PowerPoint design can be downloaded and save into JPG and PDF format. High resolution ensures no pixel break. PPT diagram downloadable in standard and widescreen view. Fully adjustable slide as works well with Google slides. Easy to adjust and present when required. Quick to share message effectively.
-
 Status symbol four circles loading round progress bar 1
Presenting status symbol four circles loading round progress bar 1. This is a status symbol four circles loading round progress bar 1. This is a four stage process. The stages in this process are status symbol, status icon.
-
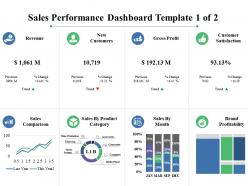 Sales performance dashboard revenue new customers
Providing sales performance dashboard revenue new customers PowerPoint template. PPT graphic can be shared in standard and widescreen view. High resolution picture quality ensures no pixel break up even when shared with large set of audience. Presentation slide is adaptable with Google slides. Magnificent to share business communication effectively. PPT slide is available with different nodes and stages. PowerPoint design can be edited as needed and change into JPG and PDF format.
-
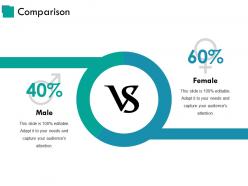 Comparison ppt inspiration
Presenting this set of slides with name - Comparison Ppt Inspiration. This is a two stage process. The stages in this process are Compare, Percentage, Male, Female, Finance.
-
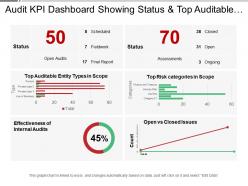 Audit kpi dashboard showing status and top auditable entity types
Presenting this set of slides with name - Audit Kpi Dashboard Showing Status And Top Auditable Entity Types. This is a six stage process. The stages in this process are Audit, Examine, Survey.
-
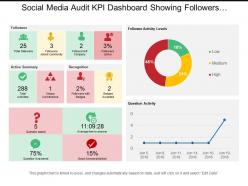 Social media audit kpi dashboard showing followers activity summary and activity leads
This PPT template is very useful for your business PowerPoint presentation. It is fully editable and has editable features like editable font, font size, font color, etc. There are many shapes to choose from like squares, triangles, circles, rectangles, pentagon and many more shapes in order to edit this presentation in PowerPoint. All the images in this PPT are 100% editable. The excel-linked charts in this PPT template can also be edited with ease. It can be viewed and saved in JPG or PDF format. It is fully compatible with Google slides as well.
-
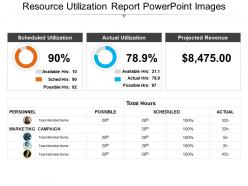 Resource utilization report powerpoint images
Presenting resource utilization report PowerPoint images PPT slide. This is a self-explanatory and intellectual slide design. There is the use of visually impressive colors and stunning picture quality. High-resolution images do not pixelate when projected on a wide screen. PPT is compatible with numerous software and format options. 100 percent editable slide design components. Modify the presentation elements as per the need of the hour. Personalize the PPT with your company name and logo. Used by entrepreneurs, marketers, managerial department, stakeholders and students.
-
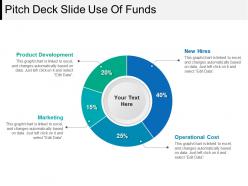 Pitch deck slide use of funds powerpoint show
Presenting Pitch Deck Slide Use Of Funds PowerPoint Show. You can make the necessary alterations in the font color, font size, and font style of the slide as it is entirely customizable. The color of the text and background can be formatted. You can add or edit text anywhere in the PowerPoint template. Its compatibility with Google Slides makes it accessible at once. You can transform and save the slide in PDF and JPG formats as well. Get this high-quality slide to add value to your presentation and present it in front of thousands of people on standard screen and widescreen.
-
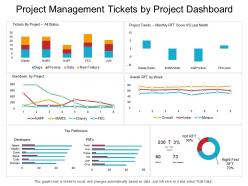 Project management tickets by project dashboard
Presenting this set of slides with name - Project Management Tickets By Project Dashboard. This is a six stage process. The stages in this process are Project Proposal, Project Plan, Project Management.
-
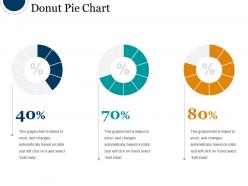 Donut pie chart powerpoint slide presentation examples
Presenting Donut Pie Chart PowerPoint Slide Presentation Examples which is completely editable. Open and save your presentation in various formats like PDF, JPG, and PNG. This template is compatible with Google Slides which makes it easily accessible at once. This slide is available in both 4:3 and 16:9 aspect ratio. Alter the font, color, font size, and font types of the slides as per your needs.
-
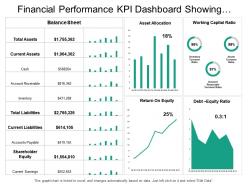 Financial performance kpi dashboard showing asset allocation balance sheet
Presenting this set of slides with name - Financial Performance Kpi Dashboard Showing Asset Allocation Balance Sheet. This is a two stage process. The stages in this process are Financial Performance, Financial Report, Financial Review.


